The Chancellor’s attempt to increase capital investment in her first budget resulted in a negative reaction from the bond market. As growth slows, the Chancellor needs to fundamentally rethink her approach. Instead she should follow the tried and tested approach of delivering infrastructure through public corporation debt. This will not only drive up the rate of growth, but will do it without negatively impacting government bond yields, writes Thomas Aubrey, founder of Credit Capital Advisory.

One of the questions the UK Government’s New Towns Taskforce has had to grapple with as it identifies potential locations for new urban conurbations is the critical question of how integrated housing and transport plans might be funded and financed.
The problem for the Government as it considers the recommendations is that economic growth is weak, and indeed productivity growth is negative. As the UK Government refinances its debt at higher interest rates, interest payments will increase and therefore a greater proportion of public expenditure will need to be allocated towards debt servicing. Given that growth has not materialised, the public finances are deteriorating which is why the markets are looking for spending cuts in the November 2025 budget. And yet new housing and transport are badly needed
The Chancellor, Rachel Reeves, at the last budget decided to increase taxes based on the idea the revenues would facilitate more borrowing for capital investment including infrastructure. The bond markets’ reaction to the budget, however, indicated it did not believe this strategy would make the UK economy more productive. If we compare the UK with the Netherlands – which in terms of population density is quite similar and hence has a similar demand for infrastructure and housing – the spread between the UK and Dutch 10-year yields jumped by over 30 bps following the budget, and the UK is now close to 190 bps above Dutch 10-year yields. By contrast, between 2015 and the 2024 Autumn budget the spread averaged just 100 bps.
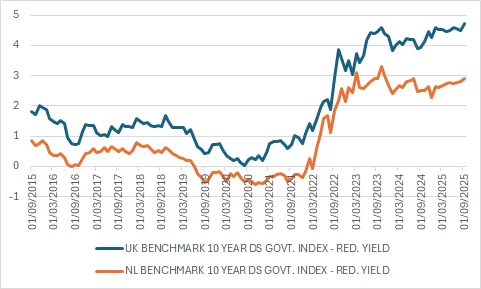
Source: LSEG Datastream, Credit Capital Advisory
One reason behind the bond market’s scepticism is due to the failings of the overcentralised sclerotic UK state. Whitehall believes it can drive growth by handing out capital investment grants to good causes. This assumes these projects will be delivered on time and on budget and will subsequently increase the productive capacity of the UK economy, thereby generating higher tax revenues. However, there is quite a bit of evidence that supports the bond market’s scepticism of this approach.
The weak relationship between funding and delivery results in governance challenges leading to budgeting and timing issues due to misaligned incentives. In the event a delivery body fails to meet its commitments, there is an expectation that central government will continue to provide additional handouts. This is due to the sunk costs already incurred.
Furthermore, when capital investments are granted for local transport projects, these projects rarely provide adequately detailed integrated plans with housing, resulting in less housing being delivered and hence lower growth than ought to be possible in higher productivity locations. For example, the Leeds Tram is expected to cost £2bn, but only an additional 7,000 housing units were announced to accompany this investment by the Chancellor.
One tried and tested alternative approach is for public corporations to raise their own debt, relying upon multiple revenue sources including land value capture and receipts from infrastructure to self-fund the project. This was the approach the UK pioneered during the Victorian era which built vast swathes of infrastructure – much of which we are still using. This model has been highly influential across Europe including countries like the Netherlands where integrated housing and transport projects are regionally driven and mostly self-funded.
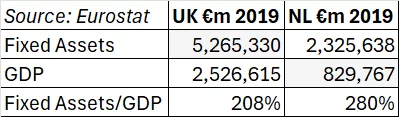
As a result, the Dutch economy has become more productive without negatively impacting its public finances. Using the last directly comparable data for fixed assets which can be used as a proxy for the infrastructure stock, the Netherlands has stock as a percentage of GDP of 280% compared to just 208% for the UK.
This higher level of infrastructure stock as a share of GDP is one reason why the Netherlands generates $92.89 of GDP per hour compared to the UK’s $79.49 according to OECD data. Housebuilding completions per 1,000 of population in the Netherlands have been close to six over the long run compared to just three and a half in the UK,[1] which is also one reason why house price to income ratios are slightly lower in the Netherlands at 6.0 compared to 7.7 in England. So why can’t the UK return to the model that built a significant chunk of its infrastructure, and have a faster growing economy without negatively impacting the public finances? This would require the UK to move away from using gilts in the hope that the economy in aggregate generates more tax revenues, towards a system where infrastructure is paid for by hypothecated cash flows.
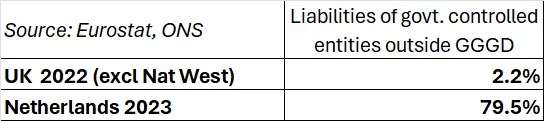
Table 2 below indicates the difference in the two approaches with the Netherlands financing assets close to 80% of GDP (via liabilities) using public corporation debt. Clearly not all of this investment is in infrastructure, but this data includes bodies such as BNG, the Dutch development bank which plays a major role in financing infrastructure. This compares to just 2% in the UK which principally relies on gilt financing.
The bond market appears to view the UK’s strategy of relying on increases in future taxation to pay back sovereign debt as the far riskier bet compared to the Dutch model. Yet despite the lower risk and higher success of the self-funding public corporation model, the UK Treasury has ruled itself out from pursuing this tried and tested approach. This is because it has unilaterally diverged from international accounting standards to include public corporation debt that is paid back by market sources in its fiscal rule – in stark contrast to the EU economies.
This means that wealthy areas like Oxford, Cambridge, London and Bristol are not developing financially viable integrated housing and infrastructure projects by exploiting the new land value capture rules introduced by the last government (LURA 2023) which unlocks up to an additional £10bn per annum. The Government instead hands grant to these wealthy places rather than others that are more in need of the funding.
The Treasury’s divergence from international accounting standards has also created an artificial distinction by excluding public private partnership contingent liabilities from the fiscal rule but including public corporation contingent liabilities. This is incoherent as what ultimately matters to the public balance sheet is the risk of the project and not whether the proximate owner is a public or private entity as in both cases the government becomes the ultimate backstop. The Treasury should be far more focused on the risk of projects and not ownership, particularly given the governance failures within central government as highlighted by the NAO.
Should the Chancellor decide to bring the UK in line with international accounting standards, the UK’s published public finances would dramatically improve, permitting a transformation of its growth potential. A wave of self-funded new towns could be built enabling high-growth firms to expand by closely integrating transport and housing in high productivity areas. The net result of this would likely be lower gilt yields given there will be higher growth with its higher tax receipts and lower gilts issuance.
[1] Aubrey, Policy Network. Britain’s dysfunctional housing market: a European comparison (2015)
The views and opinions expressed in this post are those of the author(s) and not necessarily those of the Bennett Institute for Public Policy.


