Dr John Lourenze Poquiz and Nghi Nguyen explore the characteristics of early business AI adopters in the UK during the period of ChatGPT's public launch in late 2022, which increased public awareness of AI and its potential businesses.

There is no shortage of studies discussing the expected impacts of AI, from productivity gains to job losses. However, remarkably little is known about which firms’ adoption patterns, especially in the UK.
Headline adoption rates do not tell us anything about whether AI is spreading across the economy evenly or is concentrated among an already-advantaged elite. To answer these questions, we draw on two rich UK data sources from the Office for National Statistics (ONS): the Management and Expectations Survey (MES)[i] and the Business Insights and Conditions Survey (BICS)[ii]. We present four stylised facts about AI adoption among UK enterprises. The picture that emerges is more nuanced, and in some ways more surprising, than the prevailing narrative suggests.
Result 1: Size does matter
Early evidence about AI’s potential to boost economic growth and productivity has shown productivity gains, even before Large Language Models (LLMs) entered the mainstream. Given this promise, you’d expect that firms would be lining up to adopt AI.
The data however tells us a more complicated story. The BICS survey shows that some companies adopt much faster than others. Figure 1 shows change in AI adoption among UK companies between 2023 and 2025. Between 2023 and 2025, large firms (250+ employees) nearly doubled their adoption rate to 44% from less than 20% in 2023. Meanwhile, small firms (fewer than 50 employees) gained far less ground, reaching just 26%.
The UK’s AI uptake looks less like a rising tide and more like a two-speed race, with larger firms pulling further ahead even as the starting gun is still being fired. This matters because small businesses make up the majority of UK firms. If AI adoption remains concentrated among a small number of larger players, its contribution to economy-wide productivity growth will be limited.
Figure 1: AI adoption rates among UK companies, by employment size (2023 and 2025)
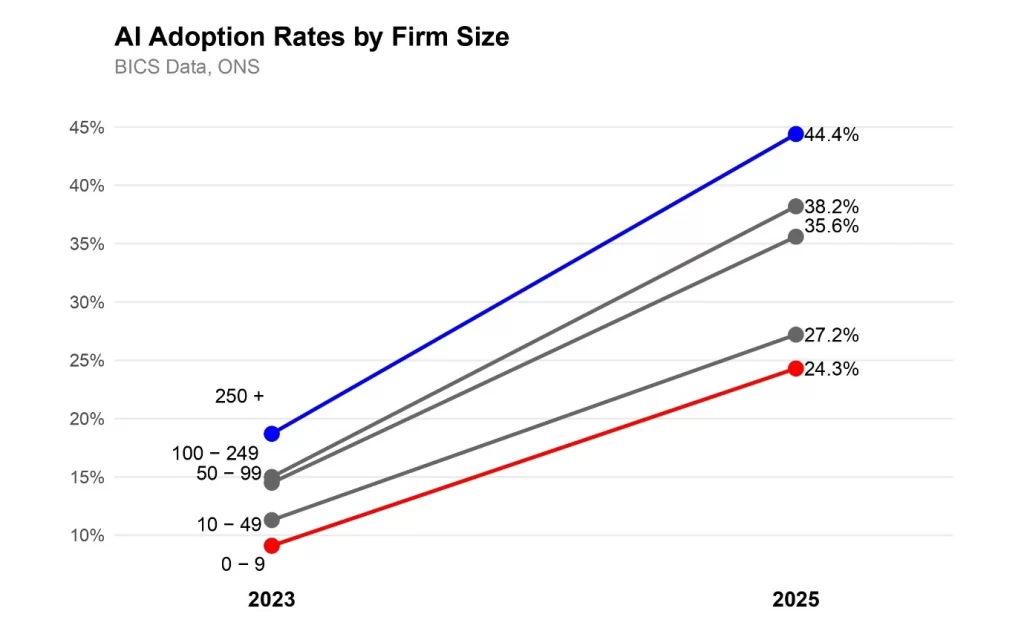
Source: Authors’ calculations; BICS
Result 2: AI users are not necessarily more productive
One might assume that AI is being taken up primarily by productive firms with the resources, talent, and organisational capacity to experiment with new technology. But when we compare the productivity of AI adopters against non-adopters by plotting how firms are distributed across the productivity spectrum, Figure 2 shows that the two groups look almost identical. At this early stage, productivity alone does a poor job of predicting who adopts.
This is also interesting for a second reason. If AI were already delivering meaningful productivity gains, we would expect adopters to push ahead of the pack. So far, there is little sign of that. Whether this reflects the early stage of adoption, the time it takes for new technologies to show up in firm-level data, or simply that the productivity dividend has yet to materialise, remains an open question.
This also highlights that size and productivity are not the same thing. Small firms can be highly productive. What the data together suggest is that adoption is being driven by scale, rather than by underlying productivity performance
That distinction matters for policy. The concern is not that AI is widening the gap between high and low performers. It is that it may be widening the gap between large and small businesses. These are different problems requiring different solutions, focused on reducing the structural barriers that prevent smaller firms from adopting the technology.
Figure 2: Distribution of log labour productivity in 2023 for AI users and non-users
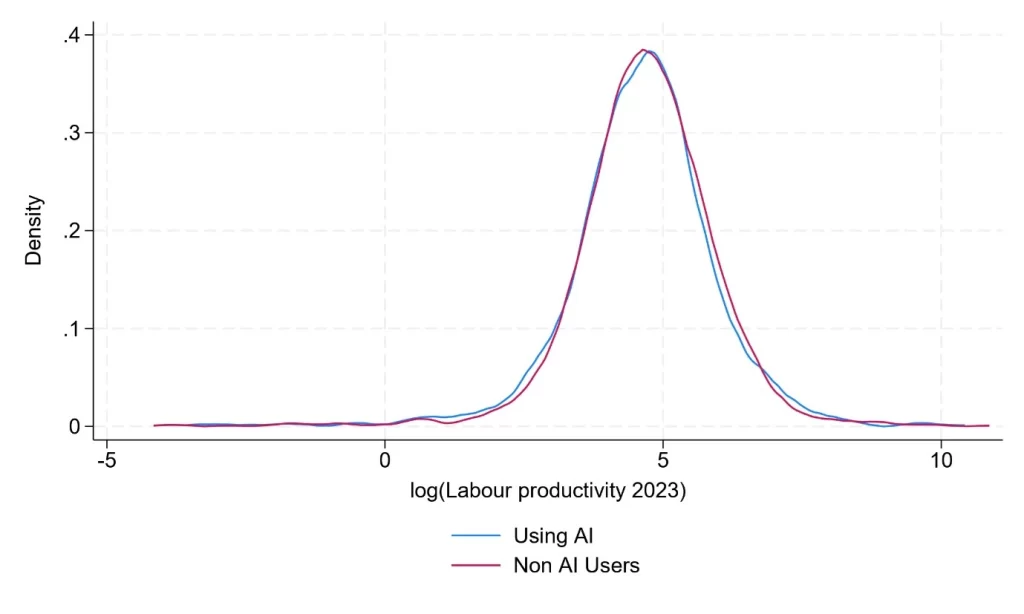
Source: Authors’ calculations; MES
Result 3: AI adopters are not those with the highest costs
If productivity doesn’t separate AI adopters from non-adopters, perhaps costs do. Firms with larger operations spend more on inputs and one might expect these resource-intensive businesses to be best placed to invest in and deploy AI. Figure 3 tells a more nuanced story.
It plots how firms are distributed by their intermediate expenditures, which includes operating expenses. These expenditures[iii] include utility bills, advertising and marketing services, outsourcing, materials and supplies, and so on.
Interestingly, the data shows that AI-using companies are more tightly clustered around a lower level of intermediate expenditure, with fewer of them incurring very high costs.
There are two ways to read this finding. The first is that AI is already doing its job in terms of cost-savings. Firms that have adopted it spend less on inputs because the technology helps them operate more efficiently. This reading is consistent with data from the BICS, which found in late 2023 that 36% of adopters used AI to improve business operations. More specifically, the most popular uses of AI at the time included text generation using LLMs; data processing using machine learning; and visual content creation. These could, for example, imply reduction in spending on external advertising services, or less outsourcing for customer service in favour of using chatbots.
The second reading is a selection story whereby firms that already prefer to run lean operations are more likely to turn to AI in the first place. The data alone cannot tell us which explanation is correct, but either way the pattern suggests a tight link between AI adoption and cost-consciousness that our next result explores more directly.
Figure 3: Distribution of log intermediate expenditure in 2023 for AI users and non-users
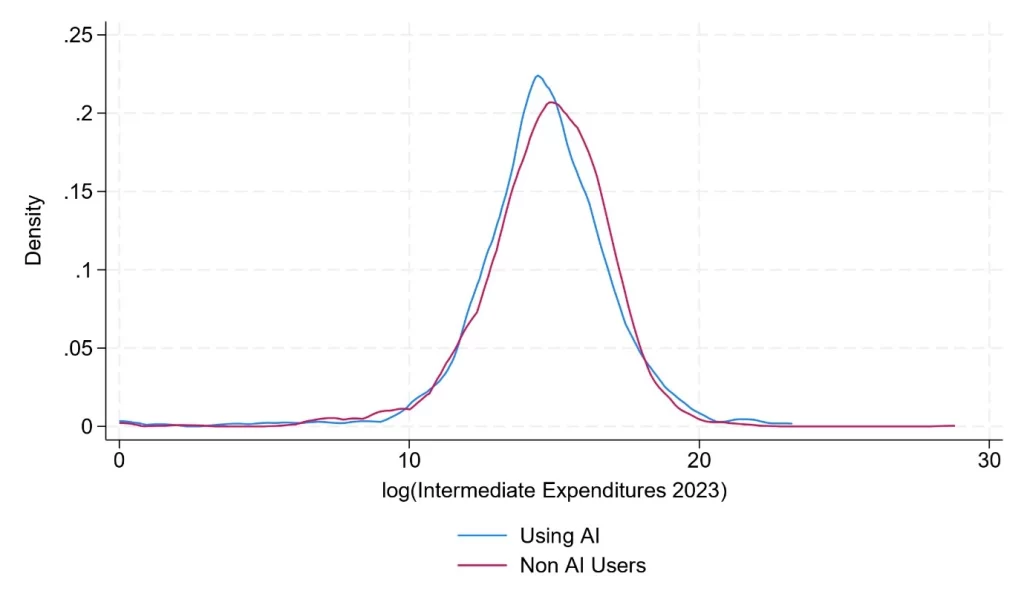
Source: Authors’ calculations; MES
Result 4: Firms with better structured management are more likely to adopt AI
The MES provides unique data on the management practices of its respondents, assigning scores for four elements: continuous improvement, use of Key Performance Indicators (KPIs), target monitoring and employment practices.
An overall management score (ranging from 0 to 1) is calculated as the average of the four sub-scores. A management score closer to one means the company continuously reviews its processes for improvement, conducts regular performance reviews, trains workers, employs and promotes based on merit. Finally, we determine which decile of management score each company falls in – the tenth decile comprising the best-managed businesses on these metrics.
In Figure 4, each red dot shows the AI adoption rate for each management-score decile for MES 2023 respondents. The vertical blue lines show the 95% confidence interval – they capture the uncertainty around each estimate. The dashed horizontal line marks the overall average AI adoption rate (10%) across all MES respondents.
We can see that the red dots move higher as the deciles (x-axis) go from one to ten. This suggests a positive correlation between structured management practices and AI adoption among UK companies.
Figure 4: AI adoption rate per decile of management score in 2023
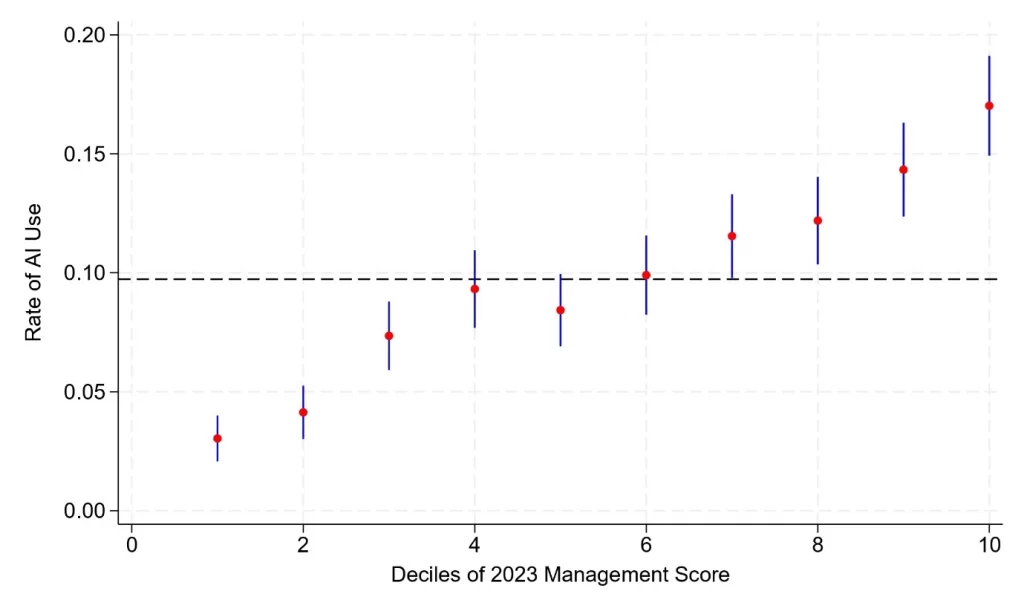
Source: Authors’ calculations; MES
Final notes
The patterns we present are descriptive stylised facts drawn from survey data at a single point in time. We make no claim that AI adoption causal impact on productivity, lower costs, or better management. Establishing those causal relationships requires more data, and more sophisticated methods than a cross-sectional snapshot allows. But understanding who is adopting AI, at what pace, and with what expectations is a necessary first step before researchers can even ask causal questions. As AI continues to reshape the business landscape, mapping the terrain carefully is the foundation on which better research and better policy can be built.
In our next blog post and accompanying working paper, we will examine the relationship between structured management and AI adoption in more detail — exploring which elements of management matter most.
[i] The MES provides representative data on UK firms’ management practices, business expectations and technology use. The survey is conducted every three years (2017, 2020 and 2023). The latest 2023 wave sampled over 53,000 companies and achieved a response rate of 27%. The survey excludes micro-businesses (fewer than 10 employees) and those in agriculture, financial services and the public sector.
[ii] The BICS is collected twice monthly, which offers a higher-frequency lens on AI adoption as it unfolds in real time. The BICSs has a smaller sample size, with 39,000 firms in the sample, but is collected more frequently.
[iii] Intermediate expenditures does not include fixed costs such as machinery purchases or spending on structures, which the companies have to pay regardless of how many goods they produce in a year.
The views and opinions expressed in this post are those of the author(s) and not necessarily those of the Bennett Institute for Public Policy.