The latest UK productivity figures may reveal the beginning of a genuine improvement in productive capacity after years of disappointing performance. Thomas Aubrey argues that better measurement needs to focus on what improves diagnosis and action.

In 1950, an American statistician gave a lecture to a group of Japanese senior managers at a conference on the shores of Lake Ashi in Kanagawa prefecture. The statistician urged industry leaders to use statistical techniques across the entire production process, enabling informed decisions to be taken.
The statistician was Dr W. Edwards Deming. He believed that knowledge required understanding entire systems. As Demings famously noted: “Information is not knowledge. The world is drowning in information but is slow in acquisition of knowledge.” Japan’s industrial leaders subsequently embarked upon a measurement revolution from which emerged lean manufacturing, an idea that propelled Japanese industry to leapfrog their competitors, demonstrating a clear competitive advantage.
A similar challenge confronts UK productivity analysts today. The UK has lots of productivity data, but it may not yet have sufficient knowledge to support policy decisions. This has been exacerbated by ongoing data issues with the Office for National Statistics (ONS) Labour Force Survey (LFS).
The most recent productivity data highlights this challenge as shown in Table 1. Labour productivity growth is wildly different depending on which dataset is used. The Labour Force Survey – which traditionally provided the foundational data to compute productivity performance – indicates that between 2019 and 2026 the economy grew by two percentage points more slowly than the real time information (RTI) data from the HMRC/PAYE database.
Table 1: Measure of GDP per hour growth by data source
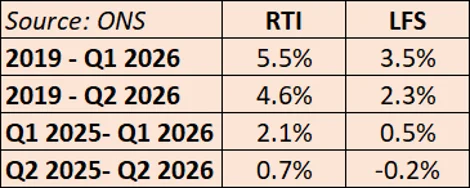
Figures show growth for the whole period indicated.
The recent ONS Productivity Flash Estimate states that for an aggregate view of the economy RTI data should be used. That is good news insofar as RTI points to faster growth, but it still does not explain which sectors are driving it. Our knowledge therefore remains somewhat limited. While LFS data can be used to estimate sectoral contributions, if the aggregate error may be as large as 2 percentage points, any sectoral breakdown may only add information without increasing our knowledge.
To provide policymakers with a better diagnostic tool it is feasible, using a series of assumptions, to create a sectoral dataset that combines RTI payroll data with LFS data on second jobs and self-employment. This preserves the RTI aggregate levels while uncovering enough sectoral detail to examine the varying contributions from different sectors.[1]
So what does this new dataset tell us about the much faster level of growth between 2019 and 2026, as well as the more recent period between 2025 and 2026? Table 2 indicates labour productivity growth of 5.6% between Q1 2019 and Q1 2026.
Table 2: Sectoral productivity disaggregation Q1 2019 – Q1 2026[2]
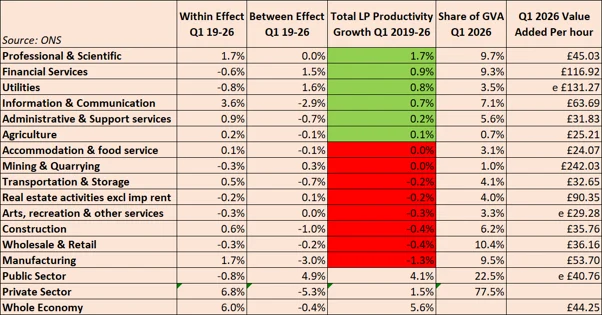
While the private sector demonstrated strong growth within the sector of 6.8%, the falling labour share in high value-added sectors such as Manufacturing and Information and Communication means that it has been impacted by a significant negative ‘between’ effect resulting in overall growth of just 1.5% over the period.
Conversely the public sector had a small negative ‘within’ effect but a large positive ‘between’ effect, reflecting an increase in the labour share from 23.8% to 26.8% in conjunction with a large increase in relative prices.[3] Using this statistical method, the much higher rate of productivity growth expressed in the RTI figures does not indicate any transformation of the underlying productive capacity of the economy. Instead, the data highlights that the state absorbed an additional 3% of the UK’s total workforce. In addition, the public sector has become more expensive to run relative to the rest of the economy.
While this might give the impression of Baumol’s cost disease whereby the state keeps up with private sector workers on wages while not increasing productivity by as much, in this instance workers in high value-added sectors are losing their jobs while the state has functioned as a macroeconomic “sponge” absorbing surplus workers.
Explanations are not hard to find. The UK’s exit from the EU required the state to take on many more functions, and the COVID pandemic led to a boost in healthcare provision in conjunction with a general upward trend in healthcare spending due to an ageing population. One big question for the new Prime Minister is whether his programme of devolution will lead to a rationalisation of public sector workers or a bigger state through increasing duplication.
Looking at the more recent underlying productivity dynamics, the same disaggregation shows the private sector is now responsible for more than half of overall productivity growth. Moreover, there are now very few sectors contributing negatively. This is a significant shift from preceding years. Furthermore, the negative ‘between’ effect that had reduced private sector growth when the earlier period is included is now close to zero.
Table 3: Sectoral productivity disaggregation Q1 2025 – Q1 2026
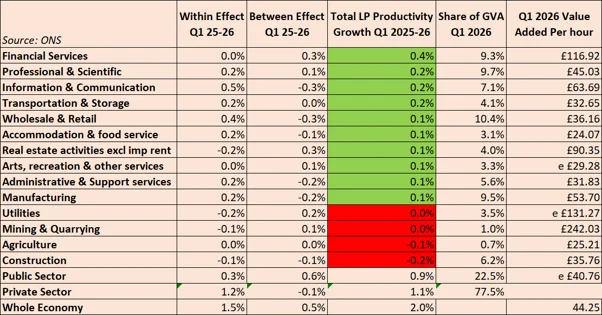
The sectors driving growth continue to be those where the UK has a competitive advantage, knowledge-intensive services. Financial Services and Information and Communication have performed well, and crucially Manufacturing appears to have slowed its pace of shedding of high value workers relative to growth, thereby alleviating its historic negative growth contributions.
Deming’s lesson is clear: measurement should deepen our knowledge in ways that support better decisions and stronger growth. The subsectors covered by the UK’s Industrial Strategy 8 should remain central to policymaking. But government should prioritise industry-developed sector plans that set out how each subsector will raise its productive capacity, including practical actions for firms. It should then embed Deming’s statistical quality control principles just as the Japanese government did to monitor the progress of growth.
In 1960, Deming was awarded Japan’s Order of the Sacred Treasure in recognition of his contribution to Japan’s industrial rebirth and worldwide success. Without measurement, neither knowledge nor good decisions can follow.
[1] LFS average hours is calculated using Total Hours / Total Jobs. RTI-based Total Jobs is based on RTI jobs adjusted to include 2nd jobs plus self-employed jobs plus unpaid jobs (allocated proportionally across all sectors). The new Total Jobs figure multiplies LFS average hours for new Total Hours. As PAYE RTI data are collected at the enterprise level and workforce jobs estimates are based on reporting units, industry allocation may differ between the two sources for large multi-industry firms. However, these assumptions can provide reasonable directional indications.
[2] The sectoral disaggregation uses GEAD (Generalized Exactly Additive Decomposition) based on Tang & Wang (2004). The ‘within’ effect is productivity growth in activities within the sector whereas the ‘between’ effect measures the change in relative size of sectors taking into account the reallocation of labour between sectors and changes in real output prices. e = estimated as ONS does not publish these values.
[3] As Tang & Wang use changes in relative prices in addition to changes in labour share, it can result in positive contributions in a below average sector when the labour share increases in combination with a large jump in relative prices. For a further discussion of the different methodologies of disaggregation see Coyle, Mei and Hampton.
The views and opinions expressed in this post are those of the author(s) and not necessarily those of the Bennett School of Public Policy.