The effects of artificial intelligence (AI) are starting to be visible in the UK productivity statistics with the rise of data centres, Thomas Aubrey argues. To what extent this is sustainable remains to be seen, given AI’s inexorable demand for electricity.

Interpreting measured labour productivity growth in the UK is challenging because of the data collection issues with the Labour Force survey (LFS). Labour productivity per hour using the LFS data indicates growth of 2.5% between 2019 and Q4 2025, and 3.5% through to Q1 2026. But an alternative Real Time Information (RTI) measure constructed from HM Revenue and Customs (HMRC) data shows much faster growth of 5.5% from 2019 to Q1 2026 (Table 1).
Table 1: Measures of GDP per hour
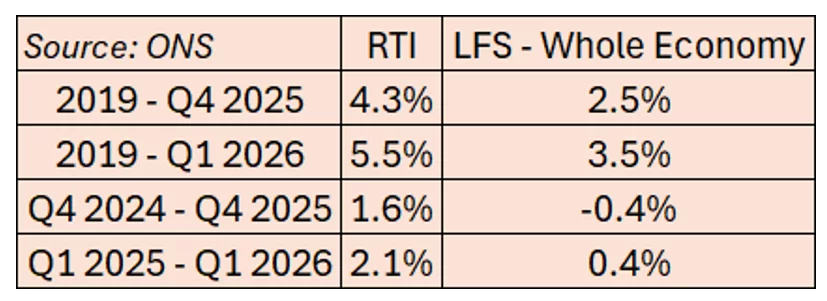
The Office for National Statistics (ONS) states that “users should apply caution not to overinterpret these results” given that “the two data series show broadly similar trends and comparable levels of volatility when comparing quarterly movements.” For those of us attempting to understand productivity, such large differences make this task challenging, particularly as the only available sectoral data is derived from the LFS.
A recent article by John Van Reenen at the LSE argues that the RTI data is more realistic as it relies on “mandatory payroll information held by HMRC”. This is almost certainly going to provide better data for output per worker measures, but as HMRC doesn’t have hours data it does not resolve the uncertainty for output per hour measures.
Van Reenen suggests that recent government policy, including the planned incremental investment of £120bn over the Parliament and planning reforms, may explain some of this growth. But he does accept that not all of the rebound in productivity is due to government policies, suggesting that “we might be witnessing the first macro-economic flowers of the AI boom.”
A sectoral decomposition can help explore these issues highlighting specific trends within the data. Although sectoral analysis can only be undertaken using LFS data, it is plausible it provides a good indication of the direction of change. So what does the sectoral data tell us?
First, it is worth noting that both measures almost certainly overstate the productivity growth rate given that whole economy output includes imputed rent. It makes sense to exclude it when thinking about which parts of the economy are becoming more productive given it is an artificial accounting construct representing owner-occupier housing services. This amounts to 0.5 percentage points of incremental growth largely due to rising housing costs between 2019 and Q4 2025, suggesting growth of the RTI-based productivity measure is 3.8% rather than 4.3%.
Second, although ONS provides a breakdown of the sectoral contribution to growth (Figure 6 here), this doesn’t consider re-allocation between sectors. For example, manufacturing, appears to contribute positively to productivity growth but has experienced such a large fall in labour share it is in fact a negative contributor to labour productivity growth. The sector made a 1.2% negative contribution to growth (Table 2).
The argument that public investment and planning have had an impact is weak. The 2024/25 budget indicated a similar amount invested to the prior year, with the 2025/26 budget indicating an additional £10bn. But an additional £10bn is unlikely to have had much impact on total growth. The Office for Budget Responsibility (OBR) has stated that the planned incremental investment will boost GDP by over 0.4%, but only after 10 years and only if it is sustained.
With regards to planning reform, the re-introduction of mandatory housing targets and the grey belt definition in December 2024 as part of the National Planning Policy Framework has not stimulated housing starts. Indeed, the construction industry remains in the doldrums with new starts below average levels. Furthermore, the Planning and Infrastructure Act only came into force in December 2025, hence is unlikely to have had any impact. However, the designation of data centres as critical national infrastructure will help in 2027 making it more likely a planning authority would approve the application given the “national economic need”. According to Tech UK “the UK data centre pipeline was worth approximately £36.4bn in planned projects as of August 2025, covering nearly 100 data centre developments across the country.”
So what does explain the more positive picture on productivity as measured by the RTI figures? Table 2 shows that between 2019 and 2025 Professional & Scientific, Financial Services and Information & Communication between them contributed two percentage points to growth.
Table 2: Sectoral productivity disaggregation 2019 – 2025[1]
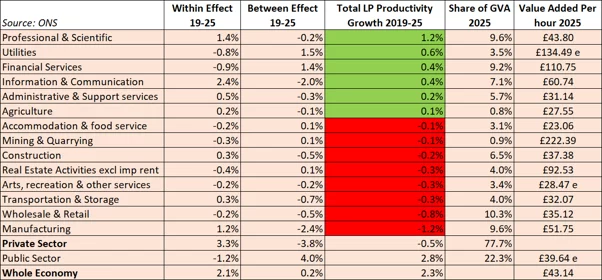
While there is no sign that artificial intelligence (AI) is causing job losses in Financial Services, it is possible we are starting to see the impact on jobs across Professional and Scientific with a falling labour share between Q4 2024 and Q4 2025. Legal and accounting firms are more susceptible to job reduction following AI deployment, although it is difficult to distinguish what job losses may be due to AI rather than the cycle in the broader business environment.
As the largest boost to value-added per hour comes from the Information & Communication sector, it is worth trying to understand whether Van Reenen’s hunch is right that we are witnessing the flowers of the AI boom.
Table 3: Disaggregation of Information & Communication real GVA growth 2019 – 2015
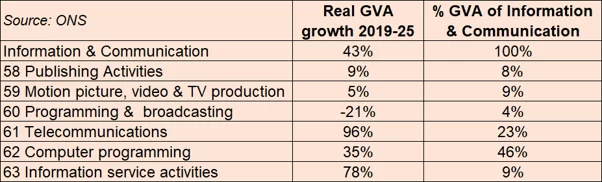
The growth in real GVA shows the two fastest growing subsectors in Information & Communication are Telecommunications and Information Service Activities. With regards to Telecoms, the new deflator published by ONS in 2022 based on this research explains some of this growth as it reallocates access charges largely to the data component whose price is declining rapidly, and therefore results in higher real GVA for Telecoms as well as contributing to measured GDP. Since 2019 the Telecoms deflator has fallen by 21%.
The other interesting dataset is the fast-growing Information service activities which includes data processing and data centres. According to TechUK, “The UK remains Europe’s largest data centre market. London accounts for around 80 percent of operational capacity and continues to lead Europe on take-up and interconnection density.”
Google opened its Waltham Cross data centre in Hertfordshire in 2025 which was announced in January 2024. The Nebius Data Centre went live in November 2025 less than six months after its initial announcement as it co-located at an existing site.
To what extent the growth of data centres is sustainable given their demand for electricity remains to be seen. However, National Grid has recently conducted a series of tests with Nebius using innovative software which dynamically adjusted the data centre’s power consumption by 40% while enabling critical AI routines to keep functioning. Hence AI consumption of electricity can be curtailed at peak times thereby avoiding an immediate demand for incremental capacity. If the sector is able to grow without causing a jump in a peak electricity demand, then it is certainly plausible that the productivity figures may continue to increase as the AI boom takes hold, and that we are indeed seeing the first flowers in the data.
[1] The sectoral disaggregation uses GEAD (Generalized Exactly Additive Decomposition) based on Tang & Wang (2004). The ‘within’ effect is productivity growth in activities within the sector whereas the ‘between’ effect measures the change in relative size of sectors taking into account the reallocation of labour between sectors and changes in real output prices. e = estimated as ONS does not publish these values
The views and opinions expressed in this post are those of the author(s) and not necessarily those of the Bennett Institute for Public Policy.