The creative industries are one of the Government’s eight key Industrial Strategy sectors, but their scale, growth and wider contribution are not always fully captured by standard statistics. A new report by Burcu Sevde Selvi examines how the sector is measured, where creative value is concentrated, what firm-level evidence reveals about finance and growth, and how questions of AI and participation are reshaping the sector’s future.

In 2023, the creative industries sector generated around £124 billion in Gross Value Added (GVA) and supported around 2.4 million jobs from July 2023 to June 2024. Yet these figures only tell part of the story. Creative businesses often generate value through intangible assets, intellectual property, creative talent and project-based production. These characteristics can make their contribution harder to measure and create challenges for both policymakers and investors trying to understand how the sector grows. This also makes it harder for firms with strong growth potential to access the finance they need to scale.
This is especially timely. As the 2025 Industrial Strategy gives the sector a more explicit role in the Government’s policy framework for growth, it becomes important to ask not only how much the creative industries contribute, but what kinds of evidence are needed to support growth across different firms, subsectors and regions.
Understanding Growth in the Creative Industries: National Trends and Firm-Level Evidence from Creative UK, examines these issues in more detail. It brings together national and regional statistics with firm-level evidence from Creative UK’s Creative Growth Finance portfolio to show why the creative economy cannot be understood through aggregate figures alone. It also considers how AI and digital technologies, alongside questions of access and participation, are reshaping the conditions for future growth in the creative economy.
The creative industries are not always easy to capture in official statistics. Standard Industrial Classification (SIC) codes remain key to estimating the sector’s scale and contribution, but they can only provide a partial view of creative activity.
The difficulty is that creative work does not always sit neatly within the industries formally classified as ‘the creative industries’. Creative workers are employed across many parts of the economy, while creative inputs can also be embedded in digital services, supply chains, design, branding and cross-sector work. These forms of activity are economically important, but can be difficult to identify through standard industrial categories alone.
This matters for policy. How the sector’s contribution is measured affects which firms, workers and places are visible in the evidence base, shaping how the creative economy is understood and where support is directed.
The creative industries have expanded substantially over the past decade, both in employment and measured economic value. But this growth is uneven across subsectors and places. Some parts of the creative industries account for a much larger share of measured economic value, particularly IT, software and computer services, advertising and marketing, and film, TV, radio and photography. Other areas, such as museums, galleries, libraries, crafts and parts of the performing arts, may generate cultural, educational and social value that is less visible in standard economic measures.
The geography of growth also shows a clear imbalance. Creative employment is spread across the UK, but creative GVA remains much more concentrated. As Figure 1 shows, creative industries make up a larger share of London’s economy than they do in most other regions. This suggests that the sector’s uneven geography is not only about where creative activity exists, but also about where it forms a significant part of the regional economy.
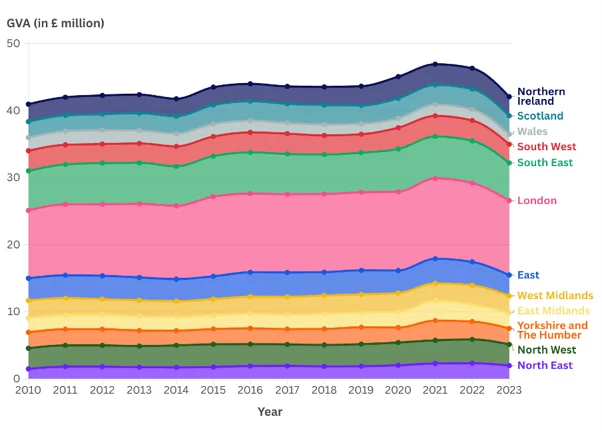
Source: Author’s calculations using Department for Culture, Media and Sport (DCMS, 2025), Sectors Economic Estimates: Regional Gross Value Added; and Office for National Statistics (ONS, 2025), Regional Gross Value Added (Balanced) per Head and Income Components. Visualisation created with flourish.studio.
The sector’s uneven geography is not simply a matter of overall economic size. Creative industries play a bigger role in some regional economies than in others, shaping where high-value activity is concentrated and where wider creative ecosystems are more established. But regional aggregates can only take us so far. They show where creative value is concentrated, but not the business-level dynamics that sit behind it, including how firms grow and how finance reaches different parts of the sector.
How creative firms grow is particularly important in a sector where much of business value sits in intellectual property, creative talent and other intangible assets that conventional finance can struggle to assess.
The new report looks at Creative UK’s Creative Growth Finance portfolio to examine a small sample of supported firms. The sample is not representative of the creative economy as a whole, but it offers a useful firm-level view of regional reach, subsector composition and growth trajectories. Many firms in the sample recorded positive revenue and employment growth, especially in digital and screen-related parts of the creative economy.
This matters because access to finance is not only a question of how much capital is available. The type of finance matters too. For policymakers and investors, the practical question is whether finance reaches firms with growth potential and whether it fits the way creative businesses create value.
Better connected evidence on firm-level growth, finance and productivity would help answer this question and show more clearly where support is reaching and where gaps remain.
Creative growth is not only a question of firms, finance and regions. It is also a question of access.
In parts of the creative industries, unpaid or low-paid entry routes, project-based employment and reliance on informal networks can make it harder for people without financial security or industry connections to enter and progress. This matters for fairness, but also for growth. A sector that draws from a narrow social base risks narrowing the range of skills, perspectives and ideas on which creative work depends.
AI and digital tools make this question more urgent. They are changing how creative work is produced, valued and governed, but the capacity to benefit from these changes is uneven. Firms and workers with access to training, legal advice, technical skills and professional networks may be better placed to adapt, while smaller firms and freelancers may face higher barriers. This means that the future of creative growth will depend not only on new technologies, but on who has the resources and opportunities to use them.
Taken together, the analysis suggests five priorities for strengthening the conditions for creative growth.
- Place-based investment should support smaller creative ecosystems: Creative activity exists across the UK, but many smaller and emerging clusters lack the finance, workspace, skills networks and institutional support needed to grow. Support should therefore recognise not only established centres but also places with developing creative potential.
- Data infrastructure should better connect: Better links between national, regional, occupational and firm-level data would help policymakers understand where creative value is generated, how firms grow and where support is not yet reaching.
- AI adoption should be aligned with creative workforce support: As AI changes how creative work is produced and valued, policy needs to consider training, intellectual property, and the position of freelancers, project-based workers and small firms that may have fewer resources to adapt.
- Creative finance, skills and innovation policy should be better connected: The sector’s growth depends not only on individual firms, but on the wider conditions that allow creative businesses to scale, adapt and build long-term capacity.
- Entry routes into creative work should become clearer and more accessible: Reducing reliance on unpaid work, informal networks and insecure early-career pathways would widen participation and strengthen the sector’s long-term talent base.
With the creative industries identified as one of the Government’s eight key Industrial Strategy sectors, the challenge is to ensure that implementation is supported by a detailed understanding of how creative value is measured, which firms can access finance, which places have the capacity to grow, and who is able to participate. This would help support a creative economy that is more resilient, more widely distributed and better equipped for long-term growth.
Read the report: Understanding growth in the creative industries: National trends and firm-level evidence from Creative UK
Read the news article: Beyond headline growth: rethinking the UK’s creative industries
The views and opinions expressed in this post are those of the author(s) and not necessarily those of the Bennett School of Public Policy.