Job availability in the United Kingdom varies sharply by place, mirroring stark regional divides in economic inactivity. Tackling the latter requires more good jobs in the right places – hundreds of thousands of them according to Christina Beatty, Peter Tyler, Colin Warnock and Geoff White. They agree with the recent Milburn report that demand as well as supply side measures are needed to take account of the places where inactivity is highest. They call for designated Inclusive Growth Areas on which these measures should be targeted.

The problem of economic inactivity is largely framed in terms of supply side factors such as long-term sickness or disability, early retirement and caring responsibilities. These are important but in his interim report on “Young people and work”(2026), Alan Milburn is right in saying they don’t tell the whole story: “Unless both supply and demand sides are addressed together, the problem will persist”.
The report is also right to identify that place matters: “Place acts not as a backdrop but as a multiplier. A young person facing identical risk factors will have worse outcomes in Hartlepool than in Harrogate … because the local economy produces fewer opportunities and local public services face more demands.”
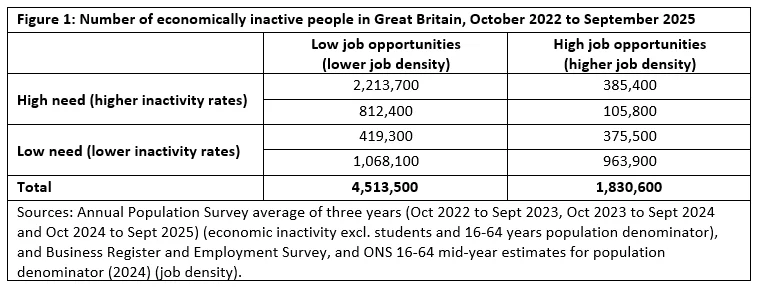
We asked, “how important are these two issues – job opportunities and place – in understanding and treating high inactivity?” To answer this, we analysed data (2022–2025) showing job density and inactivity rates by ITL3 (International Territorial Level 3) areas for England, Scotland and Wales, both benchmarked to the Great British (GB) average of one. The areas were assigned to categories according to their levels on the indicators. For example, low opportunity was defined by job density below one and high need by inactivity above one.
On this analysis, the answer is stark. Jobs and place really matter. Over 4.5 million economically inactive people (70% of the 6.3 million total) lived in areas with low job opportunities with 2.2 million of these in areas with the highest inactivity rates (Figure 1).
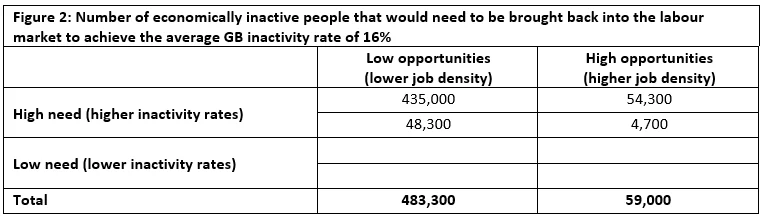
Some of these people will never return to work for a variety of reasons. But a reasonable ambition would be to reduce inactivity rates in the highest-inactivity, lowest-opportunity areas to the current GB average. Figure 2 shows that this would mean supporting almost 500,000 people back into employment in the lowest job density areas – eight times as many people as in areas with high job opportunities.
A policy map to drive inclusive growth
We need to wait on the final Milburn report for the Department for Work and Pensions to see what supply and demand-side measures it proposes. Based on our analysis, we would recommend that measures to reduce inactivity should be targeted in a consistent way on the places of greatest need.
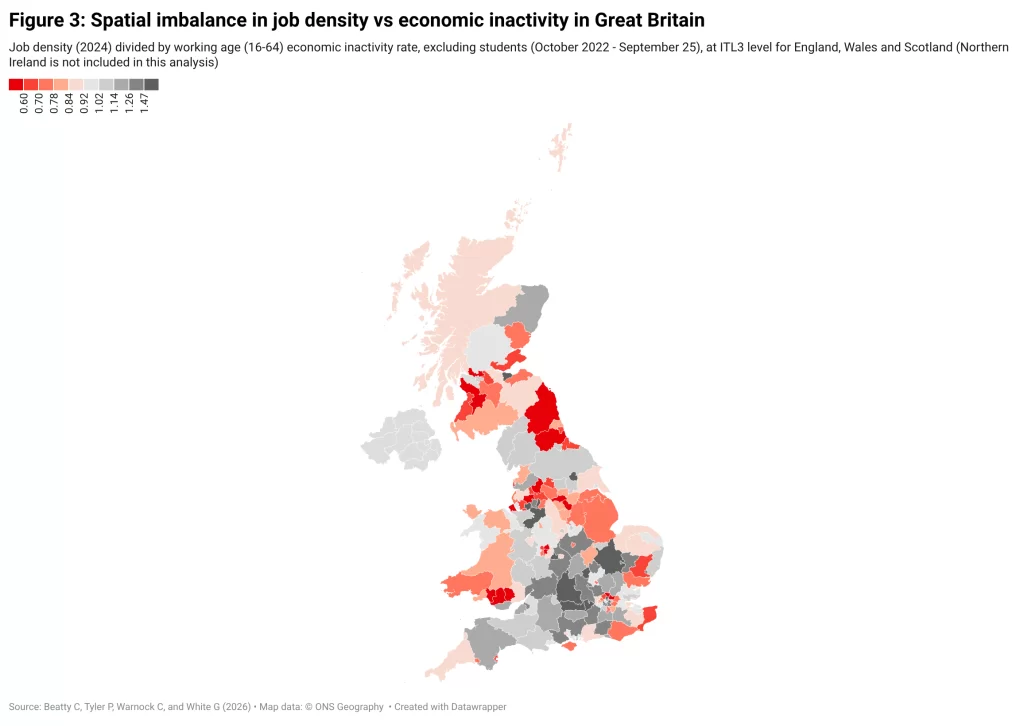
We constructed a synthetic indicator at ITL3 level for GB to identify the target areas using inactivity and job density rates. The indicator takes its lowest value where job density is at its lowest and inactivity at its highest.
The areas identified using this indicator are in shades of red in Figure 3 which we have called Inclusive Growth Areas (IGAs). They are largely old industrial and coastal areas such as North/East Ayrshire in Scotland, the valleys in Wales and, in England, the North East and Tees Valley, parts of the North West, South and West Yorkshire, West Midlands and East Midlands, Lincolnshire, parts of Suffolk and East Kent.
In our view, national and sub-national authorities should have the discretion to designate specific places within the areas eligible for IGA status. In England, they could be designated through the Local Growth Planning process, under devolution arrangements, based on analysis of local needs and aligned with national and local growth objectives.
An IGA policy map should be published. Devolved nations’ governments, sub-national authorities, and government departments (including HM Treasury), and other statutory agencies should be required to embed the map into their existing supply- and demand-side policies and to integrate it into their outcome planning, delivery and performance reporting frameworks.
Supply side measures
As suggested by the interim Milburn report, supply-side policies should provide packaged measures across apprenticeships, retraining and skills development, further education, health and disability support, childcare, and welfare-to-work incentives. They should be bespoke and targeted spatially on the IGAs because, as the Joseph Rowntree Foundation noted, inactivity disparities can be very pronounced at local levels. And better co-ordination is needed to fully unlock economic potential – again with a focus on IGAs.
Increased benefit system flexibility and additional incentives are also needed to ensure that people who are economically inactive do not stay on benefits long-term with no way back. This is likely to be a particular issue in areas with a combination of high existing levels of economic inactivity and high levels of on-flow for incapacity benefits.
Demand side measures
We recommend a range of demand side measures alongside these:
a. Investment grants
The grant regime to stimulate investment in the UK’s most deprived areas has been demolished over the last ten years. The Regional Growth Fund and European Union State Aid support with their spatial focus on many of the IGAs in Figure 3 have not been fully replaced. Yet, there is sufficient evidence from the history of regional policy on what works – and what doesn’t – that it would be straightforward for policymakers to design a new and effective programme of investment grants.
b. Fiscal incentives
There is strong evidence that targeted fiscal incentives can generate significant net increases in private sector funding (individual and corporate) over relatively short periods. New fiscal incentives in IGAs are needed because existing ones will either expire soon or will have become weaker or not adequately targeted on areas of need.
We recommend establishing new zones and enhancing existing zones in these areas with incentives such as capital gains relief, 100% first year capital allowances for investment in buildings, land and structures, employer national insurance relief, and business rates relief.
c. Wage subsidies
The government has accepted wage subsidy as a policy instrument with its Youth Jobs Grant through which businesses receive £3,000 for every young person they hire aged 18-24 years who has been on Universal Credit and looking for work for six months. This should be extended to give an incentive for employers in designated IGAs to recruit economically inactive people, for example through an employer National Insurance Contributions (NIC) holiday as proposed by the Good Growth Foundation.
d. Public purchasing
Public procurement accounted for nearly a third of UK public spending in 2023–24 and 15% of Gross Domestic Product (GDP). Two-thirds of this spending is controlled by central government, compared with the OECD average where two-thirds is determined locally.
However, the government does not position public purchasing as a key policy lever in this regard. The National Procurement Policy Statement (NPPS) nods in this direction, but only asks contracting authorities to secure social and economic value considering local growth priorities. Contracting authorities instead could “embed procurement within broader local growth strategies ensuring it strengthens local supply chains, fosters innovation and delivers long-term economic and social value” with a focus on the IGAs.
Conclusion
Tackling spatially concentrated economic inactivity is an economic necessity and a pressing moral imperative, too long neglected. It should combine demand and supply-side measures to increase job opportunities and improve access to them in designated Inclusive Growth Areas with particularly weak labour demand. We recommend the Government should target high-intensity supply-side measures and use demand-side incentives to generate jobs at the scale required in the places where the need is greatest.
Photo credit: istock.com/iprogressman
The views and opinions expressed in this post are those of the author(s) and not necessarily those of the Bennett School of Public Policy.